Support reports & analytics
Helpin provides real-time operational reporting to help support leads and workspace administrators evaluate team capacity, monitor automated deflection, track SLA adherence, and identify recurring customer issues.
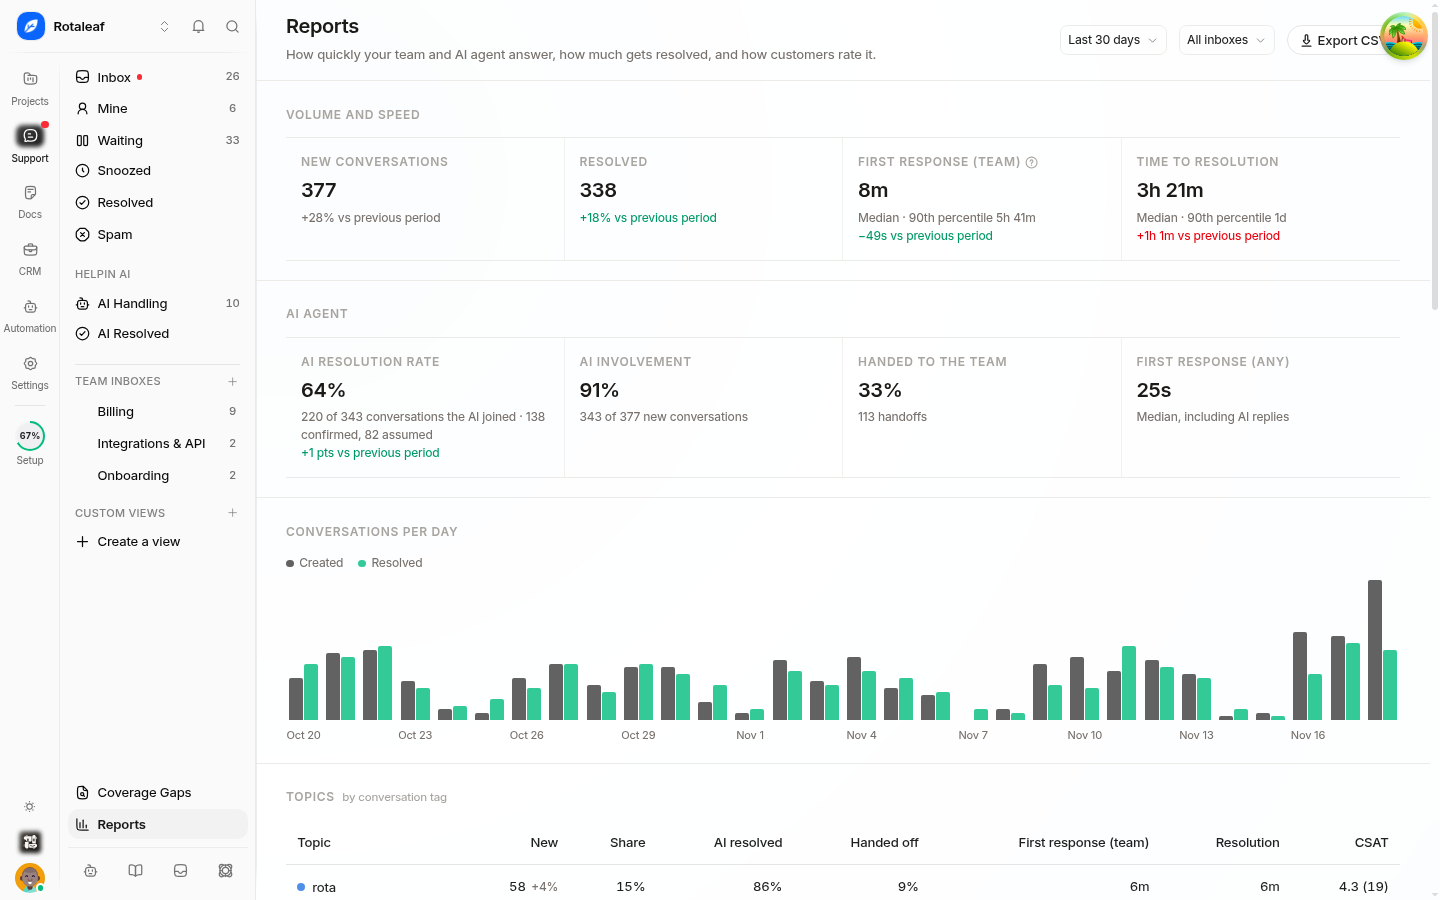
You can access workspace support metrics at Support -> Reports. This live reporting dashboard aggregates conversation, channel, agent, and self-service data across your entire workspace.
Date range filtering and data export
At the top of the Support -> Reports interface, a global date range selector controls all displayed data.
Global filtering: When you adjust the date range (such as today, last 7 days, last 30 days, or a custom range), every metric card, chart, and breakdown section updates simultaneously.
CSV exports: Every metric section includes an Export option. Clicking this downloads the underlying raw time-series or categorized data as a CSV file, allowing you to run external models or build custom stakeholder presentations.
Metric sections overview
Each reporting section presents two key data points: the current value for the chosen date range and a trend indicator reflecting the change compared to the preceding period of equal length.
Section | Metric Measured | Key Value | Trend Context |
|---|---|---|---|
New conversations | Volume of new conversations initiated across all channels | Total new inbound threads | Volume shifts versus previous window |
Resolved conversations | Volume of conversations closed or resolved | Total closed issues | Output and throughput comparison |
First response time (team) | Time elapsed from conversation creation until a human agent replies | Median / average human response time | Measures human agent availability |
First response time (any) | Time elapsed from creation until any response (AI or human) is sent | Median / average time to initial reply | Measures initial customer wait time |
Time to resolution | Duration between conversation initiation and final resolution | Median / average resolution duration | Overall turnaround efficiency |
AI resolution rate | Percentage of conversations fully handled and closed by AI | Percentage of total conversations | Automated end-to-end deflection |
AI involvement | Percentage of conversations where AI assisted or interacted | Percentage of active threads | Copilot and auto-response adoption |
Conversations handed to the team | Conversations escalated from AI to human queues | Escalation volume and rate | Inquiries exceeding automated scope |
Conversations per day | Distribution of incoming volume across days and peak hours | Daily volume counts | Demand curves for staffing allocation |
Topics | Categorization of inquiries based on tags and triage fields | Topic frequency and share | High-frequency pain points and bug clusters |
CSAT | Customer satisfaction rating collected post-resolution | Average score / percentage positive | Customer sentiment and satisfaction |
SLA targets | Percentage of conversations meeting configured SLA thresholds | Adherence rate against targets | Compliance with customer commitments |
Channels | Breakdown across chat widget, email, and customer portal | Inbound volume per channel | Channel preference distribution |
Teammates | Agent-level workload, reply volume, and resolution metrics | Individual and team tallies | Agent capacity and performance balance |
Portal self-service | Portal usage, article views, and intake form submissions | Deflection and portal traffic | Self-service impact before ticket creation |
Help assistant usage | Customer interactions with automated search and help prompts | Query counts and deflection rate | Search effectiveness and content gaps |
How to interpret the data
To diagnose operational health, evaluate related metrics in pairs rather than reviewing numbers in isolation.
Human vs. automated first response time
Comparing First response time (team) against First response time (any) illustrates the speed buffer created by your automated workflows.
If First response time (any) is seconds while First response time (team) is hours, customers receive immediate acknowledgment, but wait substantial periods for human escalation.
If both metrics trend upward, review your inbound routing schedules, staffing levels, or initial routing triage.
AI containment and escalation
Examine AI resolution rate, AI involvement, and Conversations handed to the team together:
High AI involvement paired with a high AI resolution rate demonstrates strong containment on standard queries (such as common transactional questions or standard password resets).
A high handoff rate from AI to human agents indicates that while AI engages customers, it frequently encounters complex issues outside its current knowledge boundary.
SLA compliance and capacity
The SLA targets section tracks adherence against your configured first-response and resolution policies:
Drops in SLA target attainment during specific weekdays or shifts indicate staffing deficits.
Cross-reference SLA target dips with Conversations per day to verify whether misses correlate with predictable volume spikes or specific inquiry types.
Deflection and proactive knowledge management
The combination of Topics, Portal self-service, and Help assistant usage highlights where documentation can reduce team load:
High-volume entries in Topics that also show repeated searches in Help assistant usage pinpoint topics where self-service content is incomplete or difficult to find.
Creating or updating knowledge base articles targeting these top categories lowers incoming conversation volume and drives higher portal deflection.
Operational workflows
Use the reports view during recurring operational reviews:
Staffing and shift planning: Review Conversations per day to establish agent schedules that match peak arrival hours across different time zones.
SLA tuning: Review target compliance across different queues and inboxes. If compliance consistently falls short despite normal team utilization, calibrate your SLA expectations or update routing rules.
Content and product feedback: Export the Topics breakdown monthly to share product friction points, bug trends, and billing issues with engineering and product teams.
Related pages
Was this article helpful?